Building a Skew Array in Go

Learning objectives

In the previous code along, we learned how to find “clumps” of short strings in a bacterial genome in the hopes that these clumps might lead us to the replication origin. Unfortunately, so many different biological processes involve binding to frequent substrings in a short region of the genome that we are left with nearly 2,000 different candidates to consider.

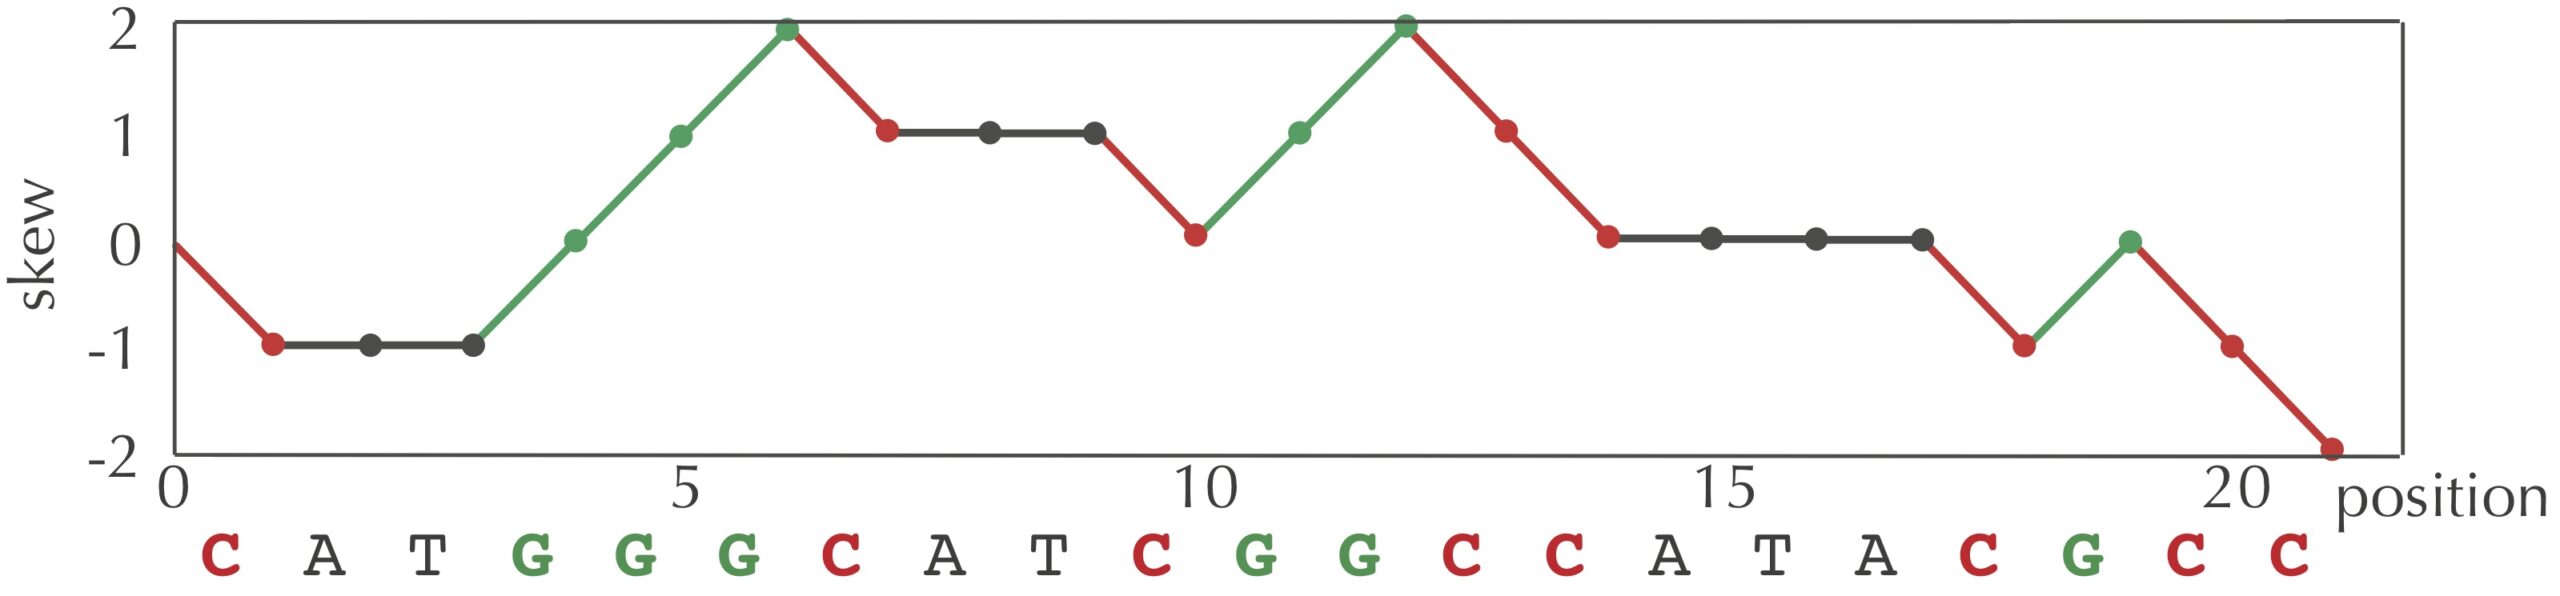
Instead, the core text introduced the concept of a skew array, whose i-th value is the difference between the total number of occurrences of

G
G and the total number of occurrences of
C
C in the first i nucleotides of a given genome. For example, the skew array of the string
"CATGGGCATCGGCCATACGCC"
"CATGGGCATCGGCCATACGCC" is [0, -1, -1, -1, 0, 1, 2, 1, 1, 1, 0, 1, 2, 1, 0, 0, 0, 0, -1, 0, -1, -2].

We can visualize a skew array with a chart called a skew diagram, a line graph that plots the number of nucleotides k encountered in genome on the x-axis, and the k-th value of the skew array on the y-axis. A skew diagram for the DNA string

"CATGGGCATCGGCCATACGCC"
"CATGGGCATCGGCCATACGCC" is shown in the figure below.

The skew diagram for genome = "CATGGGCATCGGCCATACGCC".

We can generate a skew array using the following pseudocode function SkewArray(), which calls a single subroutine Skew() that takes as input a character

symbol
symbol and returns 1, -1, or 0 based on whether
symbol
symbol is equal to
G
G,
C
C, or another character, respectively.

Plain text
Copy to clipboard
Open code in new window
EnlighterJS 3 Syntax Highlighter
SkewArray(genome)
n ← length(genome)
array ← array of length n + 1
array[0]0
for every integer i between 1 and n
array[i] = array[i-1] + Skew(genome[i-1])
return array
Skew(symbol)
if symbol = 'G'
return 1
else if symbol = 'C'
return -1
return 0
SkewArray(genome) n ← length(genome) array ← array of length n + 1 array[0] ← 0 for every integer i between 1 and n array[i] = array[i-1] + Skew(genome[i-1]) return array Skew(symbol) if symbol = 'G' return 1 else if symbol = 'C' return -1 return 0
SkewArray(genome)
    n ← length(genome)
    array ← array of length n + 1
    array[0] ← 0
    for every integer i between 1 and n
        array[i] = array[i-1] + Skew(genome[i-1])
    return array

Skew(symbol)
    if symbol = 'G'
        return 1
    else if symbol = 'C'
        return -1
    return 0

We also presented evidence that because the half of a bacterial genome preceding the replication origin has a surplus of

C
C and a shortage of
G
G, whereas the half of the genome following the replication origin has a surplus of
G
G and a shortage of
C
C. As a result, we hypothesized that that the position where the skew array achieves a minimum value (i.e., the low point of the skew diagram) would lead us to the replication origin. That reasoning led us to formulate the following computational problem.

Minimum Skew Problem

Input: A DNA string genome.

Output: All indices i of the skew array of genome achieving the minimum value in the skew array.

The following function

MinimumSkew()
MinimumSkew() solves this problem by calling
SkewArray()
SkewArray() and a function
MinIntegerArray()
MinIntegerArray() finding the minimum value of an array as subroutines.

Plain text
Copy to clipboard
Open code in new window
EnlighterJS 3 Syntax Highlighter
MinimumSkew(genome)
indices ← array of integers of length 0
n ← length(genome)
array ← SkewArray(genome)
m ← MinIntegerArray(array)
for every integer i between 0 and n
if array[i] = m
indices = append(indices, i)
return indices
MinimumSkew(genome) indices ← array of integers of length 0 n ← length(genome) array ← SkewArray(genome) m ← MinIntegerArray(array) for every integer i between 0 and n if array[i] = m indices = append(indices, i) return indices
MinimumSkew(genome)
    indices ← array of integers of length 0
    n ← length(genome)
    array ← SkewArray(genome)
    m ← MinIntegerArray(array)
    for every integer i between 0 and n
        if array[i] = m
            indices = append(indices, i)
    return indices

In this lesson, we will implement these functions in Go and apply them to the E. coli genome to find the bacterium’s origin of replication without having to run a single experiment. Along the way, we will also discuss how to visualize the skew diagram using packages for plotting. We promise that rendering the skew diagram of E. coli is well worth the effort!

Setup

Create a folder called skew in your go/src directory and create a text file called main.go in the go/src/skew folder. We will edit main.go, which should have the following starter code. The code appearing in

func main()
func main(), introduced in the preceding code along, reads in a genome from a hyperlink.

Plain text
Copy to clipboard
Open code in new window
EnlighterJS 3 Syntax Highlighter
package main
import (
"fmt"
"io"
"log"
"net/http"
)
func main() {
fmt.Println("The skew array.")
url := "https://bioinformaticsalgorithms.com/data/realdatasets/Replication/E_coli.txt"
//grab response from site
resp, err := http.Get(url)
if err != nil {
panic(err)
}
defer resp.Body.Close() // close connection at end of func main
//status OK?
if resp.StatusCode != http.StatusOK {
log.Fatalf("Received non-OK status: %v", resp.Status)
}
//access slice of symbols in file
genomeSymbols, err := io.ReadAll(resp.Body)
if err != nil {
panic(err)
}
//convert genome to string
genome := string(genomeSymbols)
fmt.Println("Genome read. It has", len(genome), "total nucleotides.")
}
package main import ( "fmt" "io" "log" "net/http" ) func main() { fmt.Println("The skew array.") url := "https://bioinformaticsalgorithms.com/data/realdatasets/Replication/E_coli.txt" //grab response from site resp, err := http.Get(url) if err != nil { panic(err) } defer resp.Body.Close() // close connection at end of func main //status OK? if resp.StatusCode != http.StatusOK { log.Fatalf("Received non-OK status: %v", resp.Status) } //access slice of symbols in file genomeSymbols, err := io.ReadAll(resp.Body) if err != nil { panic(err) } //convert genome to string genome := string(genomeSymbols) fmt.Println("Genome read. It has", len(genome), "total nucleotides.") }
package main

import (
	"fmt"
	"io"
	"log"
	"net/http"
)

func main() {
	fmt.Println("The skew array.")

	url := "https://bioinformaticsalgorithms.com/data/realdatasets/Replication/E_coli.txt"

	//grab response from site
	resp, err := http.Get(url)
	if err != nil {
		panic(err)
	}

	defer resp.Body.Close() // close connection at end of func main

	//status OK?
	if resp.StatusCode != http.StatusOK {
		log.Fatalf("Received non-OK status: %v", resp.Status)
	}

	//access slice of symbols in file
	genomeSymbols, err := io.ReadAll(resp.Body)
	if err != nil {
		panic(err)
	}

	//convert genome to string
	genome := string(genomeSymbols)
	fmt.Println("Genome read. It has", len(genome), "total nucleotides.")
}

Code along video

Beneath the video, we provide a detailed summary of the topics and code covered in the code along.

At the bottom of this page, you will have the opportunity to validate your work via auto-graded assessments that evaluate the functions covered in the code along.

Although we strongly suggest completing the code along on your own, you can find completed code from the code along in our course code repository.

Code along summary

Implementing skew array functions

First, we will implement

SkewArray()
SkewArray(), which allows us to practice ranging and working with slices.

Plain text
Copy to clipboard
Open code in new window
EnlighterJS 3 Syntax Highlighter
// SkewArray takes a string genome as input.
// It returns a slice of integers representing the skew of the genome at each position.
func SkewArray(genome string) []int {
n := len(genome)
array := make([]int, n+1)
array[0] = 0
for i := 1; i < n+1; i++ {
array[i] = array[i-1] + Skew(genome[i-1])
}
return array
}
// SkewArray takes a string genome as input. // It returns a slice of integers representing the skew of the genome at each position. func SkewArray(genome string) []int { n := len(genome) array := make([]int, n+1) array[0] = 0 for i := 1; i < n+1; i++ { array[i] = array[i-1] + Skew(genome[i-1]) } return array }
// SkewArray takes a string genome as input.
// It returns a slice of integers representing the skew of the genome at each position.
func SkewArray(genome string) []int {
	n := len(genome)
	array := make([]int, n+1)
	array[0] = 0
	for i := 1; i < n+1; i++ {
		array[i] = array[i-1] + Skew(genome[i-1])
	}
	return array
}

Next, we implement

Skew()
Skew(), which provides a refresher of if statements.

Plain text
Copy to clipboard
Open code in new window
EnlighterJS 3 Syntax Highlighter
// Skew takes a byte symbol as input.
// It returns an integer representing the skew of the symbol.
func Skew(symbol byte) int {
if symbol == 'G' {
return 1
} else if symbol == 'C' {
return -1
}
return 0
}
// Skew takes a byte symbol as input. // It returns an integer representing the skew of the symbol. func Skew(symbol byte) int { if symbol == 'G' { return 1 } else if symbol == 'C' { return -1 } return 0 }
// Skew takes a byte symbol as input.
// It returns an integer representing the skew of the symbol.
func Skew(symbol byte) int {
	if symbol == 'G' {
		return 1
	} else if symbol == 'C' {
		return -1
	}
	return 0
}

Finally, we implement

MinimumSkew()
MinimumSkew(), which relies on the
MinIntegerArray()
MinIntegerArray() subroutine that we wrote in the previous chapter.

Plain text
Copy to clipboard
Open code in new window
EnlighterJS 3 Syntax Highlighter
// MinimumSkew takes a string genome as input.
// It returns a slice of integers representing all integer
// indices minimizing the skew of the genome.
func MinimumSkew(genome string) []int {
indices := []int{}
array := SkewArray(genome)
m := MinIntegerArray(array)
for i := range array {
if array[i] == m {
indices = append(indices, i)
}
}
return indices
}
// MinIntegerArray takes as input a slice of integers.
// It returns the minimum value in the slice.
func MinIntegerArray(list []int) int {
if len(list) == 0 {
panic("Error: Empty list given as input.")
}
m := list[0]
// range over list, updating m if we find bigger value
for _, val := range list {
if val < m {
m = val
}
}
return m
}
// MinimumSkew takes a string genome as input. // It returns a slice of integers representing all integer // indices minimizing the skew of the genome. func MinimumSkew(genome string) []int { indices := []int{} array := SkewArray(genome) m := MinIntegerArray(array) for i := range array { if array[i] == m { indices = append(indices, i) } } return indices } // MinIntegerArray takes as input a slice of integers. // It returns the minimum value in the slice. func MinIntegerArray(list []int) int { if len(list) == 0 { panic("Error: Empty list given as input.") } m := list[0] // range over list, updating m if we find bigger value for _, val := range list { if val < m { m = val } } return m }
// MinimumSkew takes a string genome as input.
// It returns a slice of integers representing all integer
// indices minimizing the skew of the genome.
func MinimumSkew(genome string) []int {
	indices := []int{}
	array := SkewArray(genome)
	m := MinIntegerArray(array)
	for i := range array {
		if array[i] == m {
			indices = append(indices, i)
		}
	}
	return indices
}

// MinIntegerArray takes as input a slice of integers.
// It returns the minimum value in the slice.
func MinIntegerArray(list []int) int {
	if len(list) == 0 {
		panic("Error: Empty list given as input.")
	}
	m := list[0]
	// range over list, updating m if we find bigger value
	for _, val := range list {
		if val < m {
			m = val
		}
	}
	return m
}

Finding the minimum skew positions in E. coli

Now that we have written these functions, let’s call

SkewArray()
SkewArray() and
MinimumSkew()
MinimumSkew() on the E. coli genome and see where the skew is minimized. To do so, we will generate two slices,
EcoliSkewArray
EcoliSkewArray
and
minSkewPositions
minSkewPositions, which respectively store the skew array for E. coli and the positions where the skew is minimized.

We know that all of the indices in

minSkewPositions
minSkewPositions attain the minimum skew value in
EcoliSkewArray
EcoliSkewArray. Accordingly, we can access the array value for
minSkewPositions[0]
minSkewPositions[0] to determine the minimum skew value.

Plain text
Copy to clipboard
Open code in new window
EnlighterJS 3 Syntax Highlighter
import (
"fmt"
"io"
"log"
"net/http"
)
func main() {
fmt.Println("The skew array.")
url := "https://bioinformaticsalgorithms.com/data/realdatasets/Replication/E_coli.txt"
resp, err := http.Get(url)
if err != nil {
panic(err)
}
if resp.StatusCode != http.StatusOK {
log.Fatalf("Received non-OK status: %v", resp.Status)
}
genomeSymbols, err := io.ReadAll(resp.Body)
if err != nil {
panic(err)
}
resp.Body.Close()
genome := string(genomeSymbols)
fmt.Println("Genome read. It has", len(genome), "total nucleotides.")
EcoliSkewArray := SkewArray(genome)
minSkewPositions := MinimumSkew(genome)
fmt.Println("The minimum skew value of", EcoliSkewArray[minSkewPositions[0]], "occurs at positions", minSkewPositions)
}
import ( "fmt" "io" "log" "net/http" ) func main() { fmt.Println("The skew array.") url := "https://bioinformaticsalgorithms.com/data/realdatasets/Replication/E_coli.txt" resp, err := http.Get(url) if err != nil { panic(err) } if resp.StatusCode != http.StatusOK { log.Fatalf("Received non-OK status: %v", resp.Status) } genomeSymbols, err := io.ReadAll(resp.Body) if err != nil { panic(err) } resp.Body.Close() genome := string(genomeSymbols) fmt.Println("Genome read. It has", len(genome), "total nucleotides.") EcoliSkewArray := SkewArray(genome) minSkewPositions := MinimumSkew(genome) fmt.Println("The minimum skew value of", EcoliSkewArray[minSkewPositions[0]], "occurs at positions", minSkewPositions) }
import (
	"fmt"
	"io"
	"log"
	"net/http"
)

func main() {
    fmt.Println("The skew array.")

	url := "https://bioinformaticsalgorithms.com/data/realdatasets/Replication/E_coli.txt"

	resp, err := http.Get(url)
	if err != nil {
		panic(err)
	}

	if resp.StatusCode != http.StatusOK {
		log.Fatalf("Received non-OK status: %v", resp.Status)
	}

	genomeSymbols, err := io.ReadAll(resp.Body)
	if err != nil {
		panic(err)
	}

	resp.Body.Close()

	genome := string(genomeSymbols)
	fmt.Println("Genome read. It has", len(genome), "total nucleotides.")

    EcoliSkewArray := SkewArray(genome)
	minSkewPositions := MinimumSkew(genome)

	fmt.Println("The minimum skew value of", EcoliSkewArray[minSkewPositions[0]], "occurs at positions", minSkewPositions)
}
STOP: Open a terminal, and navigate to the skew directory using the command cd go/src/skew. Then, compile your code using the command go build and run your code using the command ./skew (Mac) or skew.exe (Windows). Where does the skew array attain a minimum in E. coli?

Visualizing the skew array using external plotting packages

Although we have found the minimum skew position in E. coli (at positions [3923620 3923621 3923622 3923623], our work is ultimately not satisfying because we lack compelling evidence that this is indeed the replication origin. To provide this evidence, we should instead visualize the skew array as a skew diagram, a task that requires us to learn how to make plots in Go.

We will first need to install code from a third party package to perform the plotting that is not included as part of the standard Go installation. This package, called gonum.org/v1/plot, is part of the gonum.org collection of packages that make scientific computing easier.

To install this package, we will need this code as well as a collection of “dependencies”, or external pacakges that this code depends on. Click here to download an archive called plottingPackages.zip. Expand this archive, and you will see four folders within plottingPackages: git.sr.ht, github.com, golang.org, and gonum.org. Move all of these folders (but not plottingPackages) into your go/src code directory.

In addition to gonum.org/v1/plot, we will be using two subpackages: gonum.org/v1/plot/plotter, which provides additional support for specific types of plots, including line graphs, and gonum.org/v1/plot/vg, which provides support for vector graphics and will be useful when we save our plot as an image. Let’s add all three of these packages to our import statements.

Plain text
Copy to clipboard
Open code in new window
EnlighterJS 3 Syntax Highlighter
import (
"fmt"
"io"
"log"
"net/http"
//plotting packages
"gonum.org/v1/plot"
"gonum.org/v1/plot/plotter"
"gonum.org/v1/plot/vg"
)
import ( "fmt" "io" "log" "net/http" //plotting packages "gonum.org/v1/plot" "gonum.org/v1/plot/plotter" "gonum.org/v1/plot/vg" )
import (
	"fmt"
	"io"
	"log"
	"net/http"

    //plotting packages
	"gonum.org/v1/plot"
	"gonum.org/v1/plot/plotter"
	"gonum.org/v1/plot/vg"
)

Next, we will start writing our plotting code. Let’s place all of the plotting code into a function

MakeSkewDiagram()
MakeSkewDiagram() that takes as input a (skew) array of integers and plots the skew diagram corresponding to this array.

We begin with creating a new plot “object” with the command

plot.New()
plot.New() from the plot package. We will then set the title, axis labels, and remove the legend.

Note: Lines like
p.Title.Text = "Skew Diagram"
p.Title.Text = "Skew Diagram" are setting “fields”, or attributes, of the plot object. We will say much more about this type of notation and other syntax encountered in
MakeSkewDiagram()
MakeSkewDiagram() when we transition to object-oriented programming in a later chapter.
Plain text
Copy to clipboard
Open code in new window
EnlighterJS 3 Syntax Highlighter
// MakeSkewDiagram takes as input an array of integers corresponding to a skew array.
// It does not return anything but saves the skew diagram
// of this array to a file.
func MakeSkewDiagram(skewArray []int) {
p := plot.New()
p.Title.Text = "Skew Diagram"
p.X.Label.Text = "Genome position"
p.Y.Label.Text = "Skew value"
//remove legend
p.Legend.Top = false
//to fill in...
}
// MakeSkewDiagram takes as input an array of integers corresponding to a skew array. // It does not return anything but saves the skew diagram // of this array to a file. func MakeSkewDiagram(skewArray []int) { p := plot.New() p.Title.Text = "Skew Diagram" p.X.Label.Text = "Genome position" p.Y.Label.Text = "Skew value" //remove legend p.Legend.Top = false //to fill in... }
// MakeSkewDiagram takes as input an array of integers corresponding to a skew array.
// It does not return anything but saves the skew diagram
// of this array to a file.
func MakeSkewDiagram(skewArray []int) {
	p := plot.New()

	p.Title.Text = "Skew Diagram"
	p.X.Label.Text = "Genome position"
	p.Y.Label.Text = "Skew value"

	//remove legend
	p.Legend.Top = false

    //to fill in...

}

We next create a collection of “point” objects that will store x- and y-coordinates of all the points that we wish to connect. We set the x-coordinate of the i-th element of the skew array to

i
i, and the y-coordinate equal to the array value
skewArray[i]
skewArray[i].

Plain text
Copy to clipboard
Open code in new window
EnlighterJS 3 Syntax Highlighter
// MakeSkewDiagram takes as input an array of integers corresponding to a skew array.
// It does not return anything but saves the skew diagram
// of this array to a file.
func MakeSkewDiagram(skewArray []int) {
p := plot.New()
p.Title.Text = "Skew Diagram"
p.X.Label.Text = "Genome position"
p.Y.Label.Text = "Skew value"
//remove legend
p.Legend.Top = false
points := make(plotter.XYs, len(skewArray))
for i, val := range skewArray {
points[i].X = float64(i)
points[i].Y = float64(val)
}
//to fill in...
}
// MakeSkewDiagram takes as input an array of integers corresponding to a skew array. // It does not return anything but saves the skew diagram // of this array to a file. func MakeSkewDiagram(skewArray []int) { p := plot.New() p.Title.Text = "Skew Diagram" p.X.Label.Text = "Genome position" p.Y.Label.Text = "Skew value" //remove legend p.Legend.Top = false points := make(plotter.XYs, len(skewArray)) for i, val := range skewArray { points[i].X = float64(i) points[i].Y = float64(val) } //to fill in... }
// MakeSkewDiagram takes as input an array of integers corresponding to a skew array.
// It does not return anything but saves the skew diagram
// of this array to a file.
func MakeSkewDiagram(skewArray []int) {
	p := plot.New()

	p.Title.Text = "Skew Diagram"
	p.X.Label.Text = "Genome position"
	p.Y.Label.Text = "Skew value"

	//remove legend
	p.Legend.Top = false

	points := make(plotter.XYs, len(skewArray))
	for i, val := range skewArray {
		points[i].X = float64(i)
		points[i].Y = float64(val)
	}

    //to fill in...

}

We now create a “line” object connecting consecutive points using a

NewLine()
NewLine() function from the
plotter
plotter package, calling
panic()
panic() if there was an error in this process. We then add this line object to our plot using
p.Add(line)
p.Add(line).

Plain text
Copy to clipboard
Open code in new window
EnlighterJS 3 Syntax Highlighter
// MakeSkewDiagram takes as input an array of integers corresponding to a skew array.
// It does not return anything but saves the skew diagram
// of this array to a file.
func MakeSkewDiagram(skewArray []int) {
p := plot.New()
p.Title.Text = "Skew Diagram"
p.X.Label.Text = "Genome position"
p.Y.Label.Text = "Skew value"
//remove legend
p.Legend.Top = false
points := make(plotter.XYs, len(skewArray))
for i, val := range skewArray {
points[i].X = float64(i)
points[i].Y = float64(val)
}
line, err := plotter.NewLine(points)
if err != nil {
panic(err)
}
p.Add(line)
//to fill in...
}
// MakeSkewDiagram takes as input an array of integers corresponding to a skew array. // It does not return anything but saves the skew diagram // of this array to a file. func MakeSkewDiagram(skewArray []int) { p := plot.New() p.Title.Text = "Skew Diagram" p.X.Label.Text = "Genome position" p.Y.Label.Text = "Skew value" //remove legend p.Legend.Top = false points := make(plotter.XYs, len(skewArray)) for i, val := range skewArray { points[i].X = float64(i) points[i].Y = float64(val) } line, err := plotter.NewLine(points) if err != nil { panic(err) } p.Add(line) //to fill in... }
// MakeSkewDiagram takes as input an array of integers corresponding to a skew array.
// It does not return anything but saves the skew diagram
// of this array to a file.
func MakeSkewDiagram(skewArray []int) {
	p := plot.New()

	p.Title.Text = "Skew Diagram"
	p.X.Label.Text = "Genome position"
	p.Y.Label.Text = "Skew value"

	//remove legend
	p.Legend.Top = false

	points := make(plotter.XYs, len(skewArray))
	for i, val := range skewArray {
		points[i].X = float64(i)
		points[i].Y = float64(val)
	}

	line, err := plotter.NewLine(points)

	if err != nil {
		panic(err)
	}

	p.Add(line)
    
    //to fill in...

}

Finally, we will draw the image corresponding to the plot. To do so, we set a unit of measurement (whose benefit will become clearer soon) by accessing the

vg
vg package. Let’s use a centimeter as our unit. Then, we will save our large skew diagram to an image called
"skewDiagram.png"
"skewDiagram.png"
whose width is 100 times the unit and whose height is 60 times the unit. To do so, we use the function
p.Save()
p.Save(), which returns an error variable if the save was unsuccessful.

Plain text
Copy to clipboard
Open code in new window
EnlighterJS 3 Syntax Highlighter
// MakeSkewDiagram takes as input an array of integers corresponding to a skew array.
// It does not return anything but saves the skew diagram
// of this array to a file.
func MakeSkewDiagram(skewArray []int) {
p := plot.New()
p.Title.Text = "Skew Diagram"
p.X.Label.Text = "Genome position"
p.Y.Label.Text = "Skew value"
//remove legend
p.Legend.Top = false
points := make(plotter.XYs, len(skewArray))
for i, val := range skewArray {
points[i].X = float64(i)
points[i].Y = float64(val)
}
line, err := plotter.NewLine(points)
if err != nil {
panic(err)
}
p.Add(line)
//setting a unit of length
unitOfLength := vg.Centimeter
// Save the plot to a PNG file.
err = p.Save(100*unitOfLength, 60*unitOfLength, "skewDiagram.png")
if err != nil {
panic(err)
}
}
// MakeSkewDiagram takes as input an array of integers corresponding to a skew array. // It does not return anything but saves the skew diagram // of this array to a file. func MakeSkewDiagram(skewArray []int) { p := plot.New() p.Title.Text = "Skew Diagram" p.X.Label.Text = "Genome position" p.Y.Label.Text = "Skew value" //remove legend p.Legend.Top = false points := make(plotter.XYs, len(skewArray)) for i, val := range skewArray { points[i].X = float64(i) points[i].Y = float64(val) } line, err := plotter.NewLine(points) if err != nil { panic(err) } p.Add(line) //setting a unit of length unitOfLength := vg.Centimeter // Save the plot to a PNG file. err = p.Save(100*unitOfLength, 60*unitOfLength, "skewDiagram.png") if err != nil { panic(err) } }
// MakeSkewDiagram takes as input an array of integers corresponding to a skew array.
// It does not return anything but saves the skew diagram
// of this array to a file.
func MakeSkewDiagram(skewArray []int) {
	p := plot.New()

	p.Title.Text = "Skew Diagram"
	p.X.Label.Text = "Genome position"
	p.Y.Label.Text = "Skew value"

	//remove legend
	p.Legend.Top = false

	points := make(plotter.XYs, len(skewArray))
	for i, val := range skewArray {
		points[i].X = float64(i)
		points[i].Y = float64(val)
	}

	line, err := plotter.NewLine(points)

	if err != nil {
		panic(err)
	}

	p.Add(line)

	//setting a unit of length
	unitOfLength := vg.Centimeter

	// Save the plot to a PNG file.
	err = p.Save(100*unitOfLength, 60*unitOfLength, "skewDiagram.png")

	if err != nil {
		panic(err)
	}
}

We are now ready to call

MakeSkewDiagram()
MakeSkewDiagram() from
func main()
func main() on the E. coli skew array that we generated previously.

Plain text
Copy to clipboard
Open code in new window
EnlighterJS 3 Syntax Highlighter
func main() {
fmt.Println("The skew array.")
url := "https://bioinformaticsalgorithms.com/data/realdatasets/Replication/E_coli.txt"
resp, err := http.Get(url)
if err != nil {
panic(err)
}
if resp.StatusCode != http.StatusOK {
log.Fatalf("Received non-OK status: %v", resp.Status)
}
genomeSymbols, err := io.ReadAll(resp.Body)
if err != nil {
panic(err)
}
resp.Body.Close()
genome := string(genomeSymbols)
fmt.Println("Genome read. It has", len(genome), "total nucleotides.")
EcoliSkewArray := SkewArray(genome)
minSkewPositions := MinimumSkew(genome)
fmt.Println("The minimum skew value of", EcoliSkewArray[minSkewPositions[0]], "occurs at positions", minSkewPositions)
MakeSkewDiagram(EcoliSkewArray)
}
func main() { fmt.Println("The skew array.") url := "https://bioinformaticsalgorithms.com/data/realdatasets/Replication/E_coli.txt" resp, err := http.Get(url) if err != nil { panic(err) } if resp.StatusCode != http.StatusOK { log.Fatalf("Received non-OK status: %v", resp.Status) } genomeSymbols, err := io.ReadAll(resp.Body) if err != nil { panic(err) } resp.Body.Close() genome := string(genomeSymbols) fmt.Println("Genome read. It has", len(genome), "total nucleotides.") EcoliSkewArray := SkewArray(genome) minSkewPositions := MinimumSkew(genome) fmt.Println("The minimum skew value of", EcoliSkewArray[minSkewPositions[0]], "occurs at positions", minSkewPositions) MakeSkewDiagram(EcoliSkewArray) }
func main() {
    fmt.Println("The skew array.")

	url := "https://bioinformaticsalgorithms.com/data/realdatasets/Replication/E_coli.txt"

	resp, err := http.Get(url)
	if err != nil {
		panic(err)
	}

	if resp.StatusCode != http.StatusOK {
		log.Fatalf("Received non-OK status: %v", resp.Status)
	}

	genomeSymbols, err := io.ReadAll(resp.Body)
	if err != nil {
		panic(err)
	}

	resp.Body.Close()

	genome := string(genomeSymbols)
	fmt.Println("Genome read. It has", len(genome), "total nucleotides.")

    EcoliSkewArray := SkewArray(genome)
	minSkewPositions := MinimumSkew(genome)

	fmt.Println("The minimum skew value of", EcoliSkewArray[minSkewPositions[0]], "occurs at positions", minSkewPositions)

    MakeSkewDiagram(EcoliSkewArray)
}
STOP: Compile and run your code. Isn’t the skew diagram of E. coli beautiful?

Before completing the code along, we will make one more change, which is to adjust

MakeSkewDiagram()
MakeSkewDiagram() to increase the font sizes of the chart title and axis labels.

Plain text
Copy to clipboard
Open code in new window
EnlighterJS 3 Syntax Highlighter
// MakeSkewDiagram takes as input an array of integers corresponding to a skew array.
// It does not return anything but saves the skew diagram
// of this array to a file.
func MakeSkewDiagram(skewArray []int) {
p := plot.New()
p.Title.Text = "Skew Diagram"
p.X.Label.Text = "Genome position"
p.Y.Label.Text = "Skew value"
//remove legend
p.Legend.Top = false
points := make(plotter.XYs, len(skewArray))
for i, val := range skewArray {
points[i].X = float64(i)
points[i].Y = float64(val)
}
line, err := plotter.NewLine(points)
if err != nil {
panic(err)
}
p.Add(line)
//setting a unit of length
unitOfLength := vg.Centimeter
// making label fonts larger
p.X.Label.TextStyle.Font.Size = 3 * unitOfLength
p.Y.Label.TextStyle.Font.Size = 3 * unitOfLength
p.Title.TextStyle.Font.Size = 4 * unitOfLength
p.X.Tick.Label.Font.Size = 2 * unitOfLength
p.Y.Tick.Label.Font.Size = 2 * unitOfLength
// Save the plot to a PNG file.
err = p.Save(100*unitOfLength, 60*unitOfLength, "skewDiagram.png")
if err != nil {
panic(err)
}
}
// MakeSkewDiagram takes as input an array of integers corresponding to a skew array. // It does not return anything but saves the skew diagram // of this array to a file. func MakeSkewDiagram(skewArray []int) { p := plot.New() p.Title.Text = "Skew Diagram" p.X.Label.Text = "Genome position" p.Y.Label.Text = "Skew value" //remove legend p.Legend.Top = false points := make(plotter.XYs, len(skewArray)) for i, val := range skewArray { points[i].X = float64(i) points[i].Y = float64(val) } line, err := plotter.NewLine(points) if err != nil { panic(err) } p.Add(line) //setting a unit of length unitOfLength := vg.Centimeter // making label fonts larger p.X.Label.TextStyle.Font.Size = 3 * unitOfLength p.Y.Label.TextStyle.Font.Size = 3 * unitOfLength p.Title.TextStyle.Font.Size = 4 * unitOfLength p.X.Tick.Label.Font.Size = 2 * unitOfLength p.Y.Tick.Label.Font.Size = 2 * unitOfLength // Save the plot to a PNG file. err = p.Save(100*unitOfLength, 60*unitOfLength, "skewDiagram.png") if err != nil { panic(err) } }
// MakeSkewDiagram takes as input an array of integers corresponding to a skew array.
// It does not return anything but saves the skew diagram
// of this array to a file.
func MakeSkewDiagram(skewArray []int) {
	p := plot.New()

	p.Title.Text = "Skew Diagram"
	p.X.Label.Text = "Genome position"
	p.Y.Label.Text = "Skew value"

	//remove legend
	p.Legend.Top = false

	points := make(plotter.XYs, len(skewArray))
	for i, val := range skewArray {
		points[i].X = float64(i)
		points[i].Y = float64(val)
	}

	line, err := plotter.NewLine(points)

	if err != nil {
		panic(err)
	}

	p.Add(line)

	//setting a unit of length
	unitOfLength := vg.Centimeter

	// making label fonts larger
	p.X.Label.TextStyle.Font.Size = 3 * unitOfLength
	p.Y.Label.TextStyle.Font.Size = 3 * unitOfLength
	p.Title.TextStyle.Font.Size = 4 * unitOfLength
	p.X.Tick.Label.Font.Size = 2 * unitOfLength
	p.Y.Tick.Label.Font.Size = 2 * unitOfLength

	// Save the plot to a PNG file.
	err = p.Save(100*unitOfLength, 60*unitOfLength, "skewDiagram.png")

	if err != nil {
		panic(err)
	}
}

After giving you the chance to check your work below, we will return once more to the core text and an epilogue, where we will remark on our approach for finding replication origins and the challenges of looking for frequent words in real genomes. You will then be ready to apply what you have learned to the chapter’s exercises.

Check your work from the code along

We provide autograders in the window below (or via a direct link) allowing you to check your work for the following functions:

  • Skew()
    Skew()
  • SkewArray()
    SkewArray()
  • MinimumSkew()
    MinimumSkew()

close

Love P4❤️? Join us and help share our journey!

Page Contents