Code along video
Although we strongly suggest coding along with us by following the video above, you can find completed code from the code along in our course code repository.
Learning objectives
In the previous code along, we learned how to find “clumps” of short strings in a bacterial genome in the hopes that these clumps might lead us to the replication origin. Unfortunately, so many different biological processes involve binding to frequent substrings in a short region of the genome that we are left with nearly 2,000 different candidates to consider.
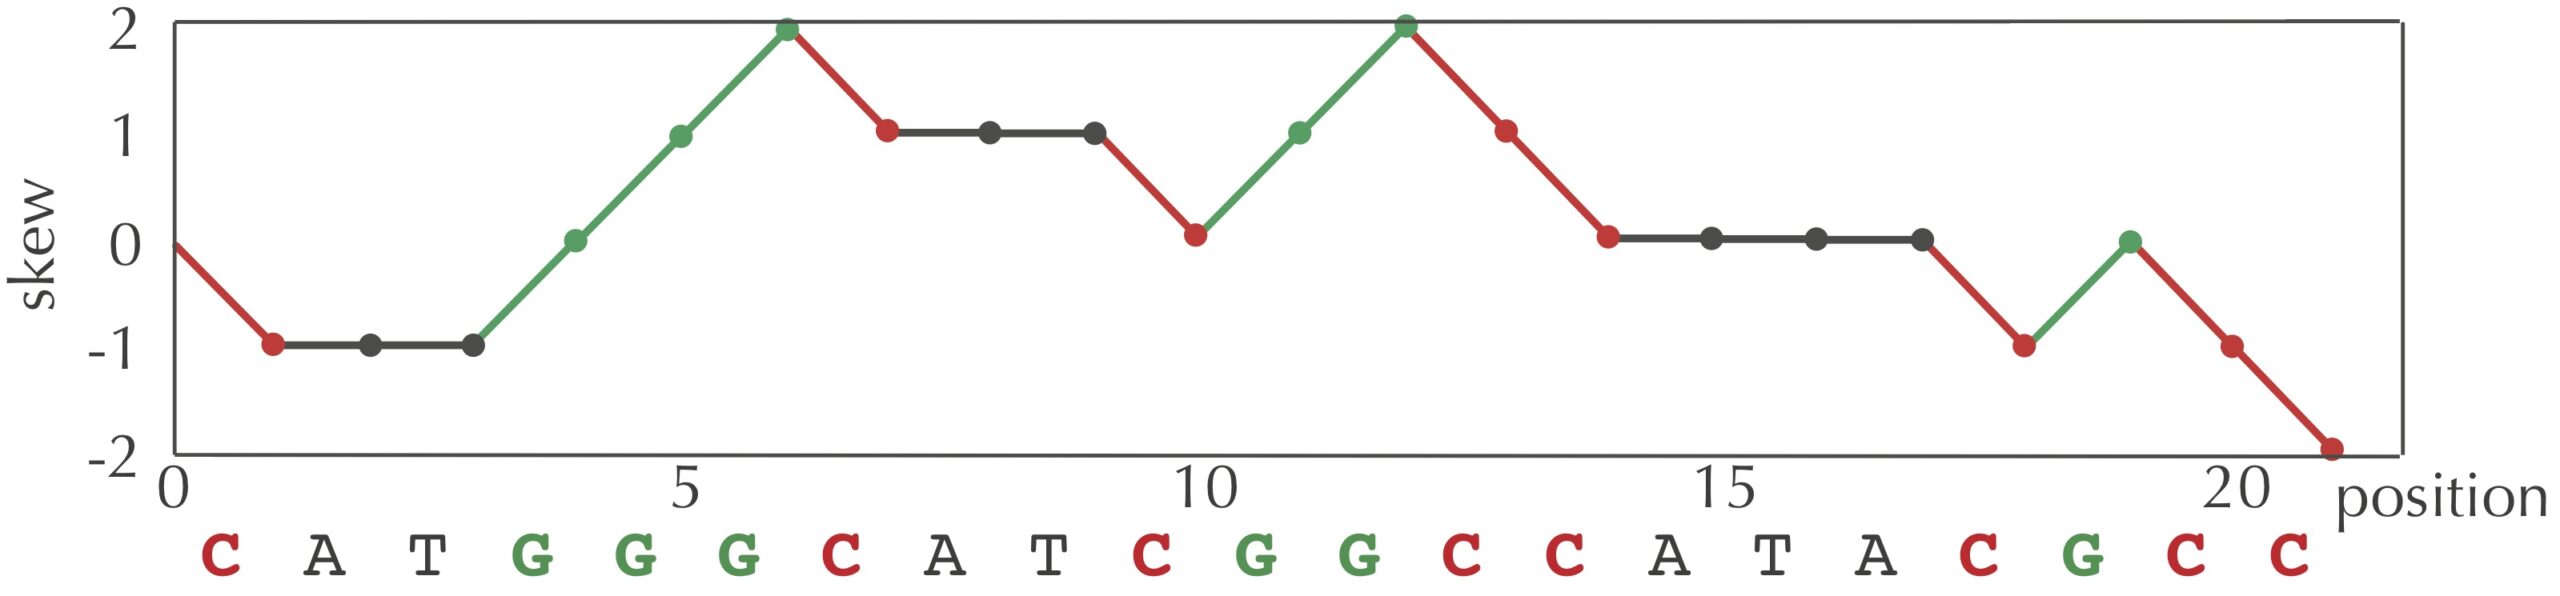
Instead, the core text introduced the concept of a skew array, whose i-th value is the difference between the total number of occurrences of G and the total number of occurrences of C in the first i nucleotides of a given genome. For example, the skew array of the string "CATGGGCATCGGCCATACGCC" is [0, -1, -1, -1, 0, 1, 2, 1, 1, 1, 0, 1, 2, 1, 0, 0, 0, 0, -1, 0, -1, -2].
We can visualize a skew array with a chart called a skew diagram, a line graph that plots the number of nucleotides k encountered in genome on the x-axis, and the k-th value of the skew array on the y-axis. A skew diagram for the DNA string "CATGGGCATCGGCCATACGCC" is shown in the figure below.
We can generate a skew array using the following pseudocode function skew_array(), which calls a single subroutine skew() that takes as input a character symbol and returns 1, -1, or 0 based on whether symbol is equal to G, C, or another character, respectively.
SkewArray(genome)
    n ← length(genome)
    array ← array of length n + 1
    array[0] ← 0
    for every integer i between 1 and n
        array[i] = array[i-1] + Skew(genome[i-1])
    return array

Skew(symbol)
    if symbol = 'G'
        return 1
    else if symbol = 'C'
        return -1
    return 0
We also presented evidence that because the half of a bacterial genome preceding the replication origin has a surplus of C and a shortage of G, whereas the half of the genome following the replication origin has a surplus of G and a shortage of C. As a result, we hypothesized that that the position where the skew array achieves a minimum value (i.e., the low point of the skew diagram) would lead us to the replication origin. That reasoning led us to formulate the following computational problem.
Minimum Skew Problem
Input: A DNA string genome.
Output: All indices i of the skew array of genome achieving the minimum value in the skew array.
The following function MinimumSkew() solves this problem by calling SkewArray() and a function MinIntegerArray() finding the minimum value of an array as subroutines.
MinimumSkew(genome)
    indices ← array of integers of length 0
    n ← length(genome)
    array ← SkewArray(genome)
    m ← MinIntegerArray(array)
    for every integer i between 0 and n
        if array[i] = m
            indices = append(indices, i)
    return indices
In this lesson, we will implement these functions in Python and apply them to the E. coli genome to find the bacterium’s origin of replication without having to run a single experiment. Along the way, we will also discuss how to visualize the skew diagram using packages for plotting. We promise that rendering the skew diagram of E. coli is well worth the effort!
Code along summary
Setup
Create a folder called skew in your python/src directory and create a text file called main.py in the python/src/skew folder. We will edit main.py, which should have the following starter code. The code appearing in main(), introduced in the preceding code along, reads in a genome from a hyperlink.
import requests

def main():
    print("Building a skew array.")

    url = "https://bioinformaticsalgorithms.com/data/realdatasets/Replication/E_coli.txt"

    response = requests.get(url)
    response.raise_for_status()

    genome = response.text

    print("The number of nucleotides in E. coli genome is", len(genome))
Implementing skew array functions
First, we will implement skew_array(), which allows us to practice ranging and working with slices.
def skew_array(genome: str) -> list[int]:
    """
    skew_array returns the list that represents the skew at each position
    of the genome. That is, the i-th position in the list is the skew at
    the i-th position of the genome.

    Parameters:
    - genome (str): A genome string.

    Returns:
    - list[int]: A list representing the skew of the genome string.
    """

    if len(genome) == 0:
        raise ValueError("genome must be a non-empty string")

    # Define the length of the genome.
    n = len(genome)

    # Define a list for the skew array.
    skew_array = [0] * (n + 1)

    # Range through the genome and add its skew at each position.

    # to fill in

    # Return the skew array.
    return skew_array
In an earlier code along, we used a dictionary literal to replace needing a match statement or long if/else if statements. We’ll reuse the same pattern here by establishing a dictionary skew:
skew: dict[str, int] = {
    "A": 0,
    "C": -1,
    "G": 1,
    "T": 0
}
We then insert this dictionary into skew_array(), and replace the subroutine call to skew() by accessing this dictionary.
def skew_array(genome: str) -> list[int]:
    """
    Computes the G-C skew array of a given genome.

    Parameters:
    - genome (str)

    Returns:
    - list[int]: the skew array of the genome, where position k is equal to
      (#G - #C) encountered in the first k symbols of the genome.
    """
    if len(genome) == 0:
        raise ValueError("Error: empty genome given.")

    n = len(genome)
    skew_array = [0] * (n + 1)

    # Dictionary mapping each nucleotide to its contribution to the skew.
    skew: dict[str, int] = {
        "A": 0,
        "C": -1,
        "G": 1,
        "T": 0
    }

    # Build skew_array using 1-based indexing over positions in the skew array.
    for i in range(1, n + 1):
        symbol = genome[i - 1]
        if symbol in skew:
            skew_array[i] = skew_array[i - 1] + skew[symbol]
        else:
            raise ValueError("Invalid symbol given.")

    return skew_array
Visualizing the skew array using Matplotlib
Now that we can generate the skew array of a genome, we want to visualize this array as a “skew diagram”, which will allow us to refresh our memory of plotting with matplotlib from our work with visualizing primes.
If you have not already followed that code along and installed Matplotlib, open a terminal and execute the command pip3 install matplotlib (on macOS/Linux) or pip install matplotlib (on Windows).
We only want to import the pyplot submodule of matplotlib, which we can import by adding the following statement to the top of main.py:
from matplotlib import pyplot
Next, we will start writing our plotting code. Let’s place all of the plotting code into a function draw_skew() that takes as input a (skew) array of integers and plots the skew diagram corresponding to this array.
We begin with using the standard pyplot.plot() function from the matplotlib
from matplotlib import pyplot

def draw_skew(skew_list: list[int]) -> None:
    """
    draw_skew draws a skew diagram using a skew_array output.

    """
    if len(skew_list) == 0:
        raise ValueError("skew_list is empty")

    pyplot.plot(skew_list)
    pyplot.title("Skew Diagram")
    pyplot.xlabel("Genome Position")
    pyplot.ylabel("Skew Value")
    pyplot.savefig("skewDiagram.png")
    pyplot.show()
Note: Lines likepyplot.title = "Skew Diagram"are setting “fields”, or attributes, of the plot object. We will say much more about this type of notation and other syntax encountered indraw_skew()when we transition to more object-oriented programming in a later chapter.
We are now ready to call draw_skew() from main() on the E. coli skew array that we generated previously.
import urllib.request

from matplotlib import pyplot

def main() -> None:
    print("Building a skew array.")
    url = "https://bioinformaticsalgorithms.com/data/realdatasets/Replication/E_coli.txt"

    # Urllib closes the connection as soon as you receive a response.
    contents = urllib.request.urlopen(url)

    # Check status code.
    print(contents.getcode())

    # Read response object.
    contents = contents.read()

    # Do some processing.
    genome = contents.decode('utf-8')
    if not genome:
        raise ValueError("Genome data is empty.")

    print("The number of nucleotides in E. coli genome is " + str(len(genome)))
    ecoli_skew_array = skew_array(genome)

    draw_skew(ecoli_skew_array)
    print("Skew diagram drawn!")
STOP: Run your code. Isn’t the skew diagram of E. coli beautiful?
Conclusion: The promise of computational biology
What is remarkable about this approach is that it doesn’t just work for E. coli; it works for essentially all bacteria, which is a rare instance of a universal biological law. We have managed to answer a real biological question (where does a bacterium start replicating its genome?) with a method that is both conceptually simple and nearly universal, relying only on the structure of bacterial genomes and the asymmetry between the occurrences of nucleotides on different parts of the genome.
Even better, we didn’t need a complicated algorithm to do it. Just careful thinking, clean code, and a willingness to let data do the work.
If you’d like to explore this further, we’d love to see what you find! Try downloading the genome of your favorite bacterium (for example, from public databases like NCBI), generate its skew diagram, and see where the minimum occurs. Feel free to share your skew diagrams in our Discord community at https://discord.com/invite/n5ZKySCKU4.
This chapter offers a microcosm for the hopes and dreams of computational biology. Instead of running thousands of physical experiments to identify bacterial replication origins — which would be slow, expensive, or even cost-prohibitive — we can run thousands of computational experiments in just a few seconds by running our algorithm on many bacterial genomes.
This naturally raises bigger questions. Where does a genome sequence come from? How do we know it’s correct? What else can we learn once we have it?
Those questions are exactly what motivate the computational study of biology. In fact, everything we’ve done here forms part of the first chapter of our popular Bioinformatics Algorithms project, which explores how algorithmic thinking lets us extract biological insight from sequence data at scale. Check it out at https://bioinformaticsalgorithms.org.
We will return to biology soon. For now, this concludes our work in this chapter, and it’s time to roll up your sleeves and work through some practice problems.
Finding the minimum skew positions in E. coli
The Minimum Skew Problem asks us to return all indices where the skew array reaches its minimum value. We already have all the pieces:
skew_array(genome)builds the skew array.- the built in
min()function, ormin_integer_array()(from a previous code along), finds the minimum element of a list.
So we can write a helper function minimum_skew() that follows the pseudocode from the book: compute the skew array, find its minimum value, and then scan for all positions that achieve that minimum.
def minimum_skew(genome: str) -> list[int]:
    """
    Returns all indices i where the skew array of genome
    attains its minimum value.

    Parameters:
    - genome (str): A genome string.

    Returns:
    - list[int]: A list of indices (0-based) minimizing the skew array.
    """

    if len(genome) == 0:
        raise ValueError("genome must be non-empty")

    # Build the skew array.
    skew_arr = skew_array(genome)

    # Find the minimum skew value using a previous helper.
    min_val = min(skew_arr)

    # Collect all indices where the skew equals this minimum.
    indices: list[int] = []
    for i, val in enumerate(skew_arr):
        if val == min_val:
            indices.append(i)

    return indices
Let’s now call minimum_skew() on the skew array for the E. coli genome and see where the skew is minimized. To do so, we will generate two lists, ecoli_skew_arraymin_skew_positionsmum_skew, which respectively store the skew array for E. coli and the positions where the skew is minimized.
We know that all of the indices in min_skew_positions attain the minimum skew value in ecoli_skew_array. Accordingly, we can access the array value for min_skew_positions[0] to determine the minimum skew value.
import urllib.request

from matplotlib import pyplot

def main() -> None:
    print("Building a skew array.")
    url = "https://bioinformaticsalgorithms.com/data/realdatasets/Replication/E_coli.txt"

    # Urllib closes the connection as soon as you receive a response.
    contents = urllib.request.urlopen(url)

    # Check status code.
    print(contents.getcode())

    # Read response object.
    contents = contents.read()

    # Do some processing.
    genome = contents.decode('utf-8')
    if not genome:
        raise ValueError("Genome data is empty.")

    print("The number of nucleotides in E. coli genome is " + str(len(genome)))
    ecoli_skew_array = skew_array(genome)

    draw_skew(ecoli_skew_array)
    print("Skew diagram drawn!")

    min_skew_positions = minimum_skew(genome)

    first_position = min_skew_positions[0]

    print("The minimum skew value of " + str(ecoli_skew_array[first_position]) + " occurs at positions " + str(min_skew_positions))

    print("Exiting normally.")
STOP: Open a terminal, and navigate to thedirectory using the commandskew. Then, run your code using the commandcd python/src/skew(macOS/Linux) orpython3 main.pypython main.py(Windows). Where does the skew array attain a minimum in E. coli?
Time to practice!
After you have the chance to check your work below, you are ready to apply what you have learned to the chapter’s exercises. Or, you can carry on to the next chapter, where we will learn about how generating random numbers can help us simulate a presidential election.
Check your work from the code along
We provide autograders in the window below (or via a direct link) allowing you to check your work for the following functions:
skew_array()minimum_skew()